RSS

"Shocking Twist in Calgary's Housing Market: Why Foreclosures Are About to Skyrocket!"

Calgary's real estate market has been a rollercoaster ride over the past year, but the latest foreclosure data reveals a startling trend that could spell disaster for homeowners and opportunity for savvy investors. Let's dive into the numbers and uncover what's really happening behind the scenes.

The graph we're examining today tracks Calgary foreclosures from July 2023 to June 2024, showing both active listings and sales. At first glance, it might seem like a jumble of blue and orange bars, but there's a story hidden in this data that demands our attention.

Let's start with the good news: foreclosure sales have generally been on a downward trend since the beginning of 2024. In February, we saw a spike with 27 sales, but that number quickly dropped to 13 in March and has remained relatively low since then. June 2024 shows only 6 foreclosure sales, the lowest point in the entire year.

But here's where things get interesting – and potentially alarming.

While sales have been decreasing, active listings have been on a wild ride. They peaked in November 2023 with a whopping 39 listings, then took a nosedive to just 25 in February 2024. Since then, we've seen a steady climb back up, with June 2024 showing 19 active foreclosure listings.

Now, you might be thinking, "19 listings isn't that bad, right?" Wrong. Here's why this number is setting off alarm bells in the real estate community:

1. The Widening Gap: Notice how the blue bars (active listings) are getting taller while the orange bars (sales) are shrinking? This indicates a growing inventory of foreclosed properties that aren't being absorbed by the market.

2. Seasonal Patterns Disrupted: Typically, we'd expect to see more activity in the spring and summer months. But this graph shows an atypical pattern, suggesting underlying economic factors at play.

3. The Calm Before the Storm: The relatively low number of current listings could be misleading. Banks often hold onto foreclosed properties, releasing them gradually to avoid flooding the market. The steady increase we're seeing could be the beginning of a much larger wave.

4. Economic Indicators: While not shown in this graph, it's crucial to consider broader economic factors. Rising interest rates, inflation, and potential job losses in key sectors could all contribute to a surge in foreclosures in the coming months.

5. The Ripple Effect: As more foreclosures hit the market, overall home values in Calgary could be negatively impacted, potentially pushing more homeowners underwater on their mortgages and creating a vicious cycle.

So, what does this mean for you?

For Current Homeowners:

- If you're struggling with your mortgage, act now. Reach out to your lender about potential modification options.

- Consider selling before a potential market downturn if you're in a precarious financial position.

- Stay informed about local economic trends that could impact your home's value.

For Potential Buyers:

- Keep a close eye on foreclosure listings. There may be opportunities to snag properties at below-market rates.

- Be cautious, though. A flood of foreclosures could drive down overall home values, so think long-term.

- Consider working with a real estate agent who specializes in foreclosures to navigate this tricky market.

For Investors:

- The growing inventory of foreclosures could present lucrative opportunities, especially if you have the capital to renovate and flip properties.

- Research neighborhoods carefully. Some areas may be hit harder than others by this trend.

- Be prepared for potential competition from large investment firms if the foreclosure market heats up significantly.

While it's impossible to predict the future with certainty, the data paints a concerning picture for Calgary's housing market. The key takeaway? Whether you're a homeowner, buyer, or investor, now is the time to stay vigilant and prepared.

Keep a close eye on foreclosure trends in the coming months. If the gap between active listings and sales continues to widen, it could signal the beginning of a major shift in Calgary's real estate landscape. Those who are prepared and informed will be best positioned to weather the storm – or even capitalize on the opportunities it may bring.

Remember, in real estate, as in life, knowledge is power. Stay informed, stay proactive, and you'll be ready for whatever the market throws your way.

Foreclosure Report on Recently Sold Properties

Read

Daily Calgary Real Estate Stats at CREB.com

The CREB Daily Housing Summary provides up-to-date statistics on Calgary's real estate market, including the number of new listings, sales, and the average price of homes. It highlights key market trends and offers insights into the performance of different property types, such as detached homes, apartments, and townhouses. The report also compares current data with previous periods to show market changes over time.

For detailed statistics, visit CREB Daily Housing Summary https://www.creb.com/Housing_Statistics/Daily_Housing_Summary

Understanding Calgary's Real Estate Market with CREB's Daily Housing Summary

In today's fast-paced real estate market, staying informed is crucial for buyers, sellers, and investors. The Calgary Real Estate Board (CREB) provides an invaluable resource through its Daily Housing Summary, offering a snapshot of current market conditions.

Key Insights for Buyers

For buyers, the summary includes the latest data on new listings, sales figures, and average home prices. This information helps buyers understand the market dynamics and make informed decisions about when and where to buy. Knowing the number of new listings can help identify potential opportunities, while sales figures and price trends provide a sense of the market's competitiveness and overall health.

Valuable Data for Sellers

Sellers can leverage this data to set realistic prices for their properties. Understanding the average prices and sales volume in their neighborhood allows sellers to price their homes competitively, increasing the likelihood of a quick sale. Additionally, tracking market trends can help sellers decide the best time to list their property to maximize their return.

Strategic Insights for Investors

For investors, the CREB Daily Housing Summary is a goldmine of information. By analyzing trends in different property types—such as detached homes, apartments, and townhouses—investors can identify which segments are performing well and adjust their strategies accordingly. This data-driven approach helps investors make informed decisions about where to allocate their resources for the best returns.

Conclusion

Overall, the CREB Daily Housing Summary is an essential tool for anyone involved in Calgary's real estate market. By providing up-to-date and detailed market statistics, it empowers buyers, sellers, and investors to make informed and strategic decisions. For the latest market insights, visit [CREB Daily Housing Summary](https://www.creb.com/Housing_Statistics/Daily_Housing_Summary/).

Staying informed and adapting to market trends can make a significant difference in achieving success in real estate. Utilize the resources available through CREB to stay ahead in Calgary's dynamic housing market.

Read

How’s the Calgary Real Estate Market?

The latest CREB stats for May 2024 indicate notable trends across the entire Calgary residential market. Here are the key highlights:

1. Sales Growth:

  • Sales slightly decreased to 3,092 units in May 2024 from 3,117 units in May 2023.

  • Year-to-date (YTD) sales have increased, with 12,412 sales in 2024 compared to 11,162 in 2023.

2. New Listings and Inventory:

  • New listings have grown significantly, with 4,333 new listings in May 2024 compared to 3,650 in May 2023.

  • The total inventory has increased to 3,402 units in May 2024 from 3,214 in May 2023.

3. Days on Market:

  • The average days on market have decreased, indicating a faster-paced market. In May 2024, it stands at 19 days, down from 24 days in May 2023.

4. Pricing Trends:

  • The benchmark price for residential homes has risen to $605,300 in May 2024, compared to $552,700 in May 2023.

  • The median price increased from $507,000 in May 2023 to $562,500 in May 2024.

  • The average price saw a significant increase, reaching $612,772 in May 2024 from $552,412 in May 2023.

5. Price Range Sales:

  • There has been notable growth in sales across higher price ranges. For example, sales in the $700,000 - $749,999 range increased from 163 units in May 2023 to 186 units in May 2024.

  • Higher price brackets, such as $1,000,000 - $1,299,999, also saw substantial growth, with sales rising from 84 units in May 2023 to 132 units in May 2024.

6. Market Trends:

  • The average price, median price, and benchmark price have all seen a year-over-year increase, indicating overall price appreciation in the market.

  • The months of inventory have trended downward, suggesting a tightening market with increased demand relative to supply.

In summary, the Calgary residential market is experiencing robust growth with increased new listings, higher prices, and a quicker turnover rate, reflecting strong demand and a healthy market environment.

We offer free home evaluations for home sellers and ready to help home buyers anytime. 

Read

How’s the Townhome Market in Calgary?

The latest CREB stats for May 2024 indicate important trends in the Calgary townhome market. Here are the key highlights:

1. Sales Growth:

  • Sales have increased to 540 units in May 2024, up from 496 units in May 2023.

  • Year-to-date (YTD) sales have risen, from 1,822 in 2023 to 2,119 in 2024.

2. New Listings and Inventory:

  • New listings have grown significantly, with 688 new listings in May 2024 compared to 562 in May 2023.

  • The total inventory has increased to 424 units in May 2024 from 406 in May 2023.

3. Days on Market:

  • The average days on market have decreased, indicating a faster-paced market. In May 2024, it stands at 18 days, down from 20 days in May 2023.

4. Pricing Trends:

  • The benchmark price for townhomes has risen to $462,500 in May 2024, compared to $387,800 in May 2023.

  • The median price increased from $386,750 in May 2023 to $457,500 in May 2024.

  • The average price saw an increase, reaching $473,913 in May 2024 from $406,597 in May 2023.

5. Price Range Sales:

  • There has been notable growth in sales across higher price ranges. For example, sales in the $450,000 - $499,999 range increased from 55 units in May 2023 to 122 units in May 2024.

  • Higher price brackets, such as $500,000 - $549,999, also saw substantial growth, with sales rising from 43 units in May 2023 to 76 units in May 2024.

6. Market Trends:

  • The average price, median price, and benchmark price have all seen a year-over-year increase, indicating overall price appreciation in the market.

  • The months of inventory have trended downward, suggesting a tightening market with increased demand relative to supply.

In summary, the Calgary townhome market is experiencing robust growth with increased new listings, higher prices, and a quicker turnover rate, reflecting strong demand and a healthy market environment.

We offer free home evaluations for home sellers and ready to help home buyers anytime. 

Read

How’s The Market For Detached Homes In Calgary?

The latest CREB stats for May 2024 indicate notable trends in the Calgary detached home market. Here are the key highlights:

1. Sales Growth:

  • Sales slightly decreased to 1,385 units in May 2024 from 1,485 units in May 2023.

  • Year-to-date (YTD) sales have increased, with 5,538 sales in 2024 compared to 5,283 in 2023.

2. New Listings and Inventory:

  • New listings have risen significantly, with 2,036 new listings in May 2024 compared to 1,795 in May 2023.

  • The total inventory has increased to 1,596 units in May 2024 from 1,484 in May 2023.

3. Days on Market:

  • The average days on market has decreased, indicating a faster-paced market. In May 2024, it stands at 18 days, down from 22 days in May 2023.

4. Pricing Trends:

  • The benchmark price for detached homes has risen to $761,800 in May 2024, compared to $674,000 in May 2023.

  • The median price increased from $657,464 in May 2023 to $730,000 in May 2024.

  • The average price saw a significant increase, reaching $822,873 in May 2024 from $733,230 in May 2023.

5. Price Range Sales:

  • Sales have increased in higher price ranges. For example, sales in the $700,000 - $749,999 range increased from 143 units in May 2023 to 168 units in May 2024.

  • Higher price brackets, such as $1,000,000 - $1,299,999, also saw substantial growth, with sales rising from 70 units in May 2023 to 106 units in May 2024.

6. Market Trends:

  • The average price, median price, and benchmark price have all seen a year-over-year increase, indicating overall price appreciation in the market.

  • The months of inventory have trended downward, suggesting a tightening market with increased demand relative to supply.

In summary, the Calgary detached home market is experiencing robust growth with increased new listings, higher prices, and a quicker turnover rate, reflecting strong demand and a healthy market environment.

We offer free home evaluations for home sellers and ready to help home buyers anytime. 

Read

How’s The Market for Calgary Condo’s?

The latest CREB stats for May 2024 indicate a strong performance in the Calgary condo market. Here are the key highlights:

1. Sales Growth:

  • Sales have increased to 908 units in May 2024, up from 857 units in May 2023.

  • Year-to-date (YTD) sales have also risen, from 3,077 in 2023 to 3,669 in 2024.

2. New Listings and Inventory:

  • New listings have grown significantly, with 1,249 new listings in May 2024 compared to 1,025 in May 2023.

  • The total inventory has also increased to 1,110 units in May 2024, from 1,090 in May 2023.

3. Days on Market:

  • The average days on market has decreased, indicating a faster-paced market. In May 2024, it stands at 22 days, down from 29 days in May 2023.

4. Pricing Trends:

  • The benchmark price for condos has risen to $340,500 in May 2024, compared to $288,900 in May 2023.

  • The median price has slightly decreased from April 2024 ($330,000) to May 2024 ($327,550), but overall, it shows an increase from May 2023 ($277,500).

  • The average price saw an increase, reaching $349,154 in May 2024 from $307,504 in May 2023.

5. Price Range Sales:

  • There has been a notable increase in sales across higher price ranges. For instance, sales in the $300,000 - $349,999 range increased from 151 units in May 2023 to 225 units in May 2024.

  • Higher price brackets, such as $400,000 - $449,999, also saw substantial growth, with sales rising from 37 units in May 2023 to 83 units in May 2024.

6. Market Trends:

  • The average price, median price, and benchmark price have all seen a year-over-year increase, indicating overall price appreciation in the market.

  • The months of inventory have trended downward, suggesting a tightening market with increased demand relative to supply.

In summary, the Calgary condo market is experiencing robust growth with increased sales, higher prices, and a quicker turnover rate, reflecting a strong demand and a healthy market environment.

We offer free home evaluations for home sellers and ready to help home buyers anytime. 

Read

Maximize Your Investment with Calgary Real Estate: Insights from a Decade of Sales Data

Investing in real estate can be a powerful strategy for building wealth, and understanding historical market trends is crucial to making informed decisions. Imagine if you had access to comprehensive data showing the highs, lows, and average sale prices of homes over the past decade in a specific Calgary community. This information is more than just numbers; it’s a roadmap to potential financial success.

Unveiling the Trends: High, Low, and Average Sale Prices

The attached charts provide a visual representation of the real estate market in one Calgary community from 2014 to 2024. The top chart illustrates the annual high, low, and average sale prices of homes, while the bottom chart showcases the corresponding prices per square foot. Here’s a closer look at what these trends reveal:

  • High Sale Prices: Tracking the peaks in the market, these figures show the potential maximum return on investment. For instance, the highest sale price in 2016 was an impressive $1,050,000, while in 2024, it reached $1,195,000.

  • Low Sale Prices: The low sale prices provide insights into the market’s entry points. In 2019, the lowest recorded sale was $320,000, presenting a significant buying opportunity.

  • Average Sale Prices: The average prices offer a balanced view of the market, showing steady growth over the years. In 2024, the average sale price was $762,121, a notable increase from $503,879 in 2014.

Price Per Square Foot: A Deeper Dive

Analyzing the sale prices per square foot further refines our understanding of property values. The bottom chart highlights the annual high, low, and average prices per square foot, offering granular insights into the market:

  • High Prices Per Square Foot: These peaks indicate premium valuations, with 2024 reaching $895 per square foot.

  • Low Prices Per Square Foot: The lows highlight opportunities to purchase properties at lower cost, such as $177 per square foot in 2019.

  • Average Prices Per Square Foot: Reflecting overall market trends, the average price per square foot in 2024 was $459, up from $330 in 2014.

Strategic Insights for Investors

By analyzing these trends, investors can gain a strategic advantage. If you could go back in time and buy at the lowest price each year and sell at the highest, the financial gains would be substantial. This historical data underscores the importance of market timing and the potential returns of astute real estate investments.

Why Contact Jerry Charlton?

Navigating the Calgary real estate market requires expertise and access to detailed data. As a seasoned Realtor since 2002, Jerry Charlton offers:

  • In-depth Market Analysis: Gain access to comprehensive historical data and market insights tailored to your investment goals.

  • Personalized Advice: Benefit from Jerry’s extensive experience and personalized guidance to maximize your investment returns.

  • Proven Track Record: With a deep understanding of Calgary’s real estate market, Jerry Charlton can help you make informed decisions that align with your financial objectives.

Don’t miss out on the opportunity to leverage this valuable information. Contact Jerry Charlton today to explore in-depth data and receive expert advice tailored to your investment needs. Let’s turn historical trends into future profits.

Read

Calgary Mortgage Rates: Understanding Your Options

When it comes to securing a mortgage in Calgary, understanding current mortgage rates is crucial for making informed decisions. The mortgage rates can vary significantly based on the type and term of the mortgage. Let's dive into the latest mortgage rates and what they mean for you as a homeowner or potential buyer.

Current Calgary Mortgage Rates

Here's a snapshot of the current mortgage rates in Calgary as of May 31, 2024:

-  5 Year Fixed:  4.79%
-  4 Year Fixed:  5.04%
-  3 Year Fixed:  4.99%
-  5 Year Variable:  6.15%
-  Prime Rate:  7.2%

Fixed vs. Variable Rates: What's the Difference?

Understanding the difference between fixed and variable mortgage rates is key to choosing the right mortgage for your financial situation.

Fixed Mortgage Rates:

Stability:  Fixed mortgage rates offer stability as the interest rate remains the same throughout the term of the mortgage. This means your monthly payments will stay consistent, making it easier to budget.

Predictability:  With a fixed rate, you'll know exactly how much interest you'll pay over the term of the mortgage, protecting you from potential rate increases.

Example:  If you choose a 5-year fixed mortgage at 4.79%, your interest rate will remain 4.79% for the next five years.

 Variable Mortgage Rates:

Flexibility:  Variable rates can fluctuate based on the prime rate set by the Bank of Canada. While this can lead to lower initial rates, there's a risk of rates increasing over time.

Potential Savings:  If interest rates decrease, you could save money with a variable rate. However, if rates rise, your payments could increase.

Example:  A 5-year variable mortgage at 6.15% means your rate could change based on market conditions, impacting your monthly payments.

Prime Rate: What You Need to Know

The prime rate, currently at 7.2%, is the interest rate that commercial banks charge their most creditworthy customers. It serves as a benchmark for various loan products, including variable-rate mortgages. When the prime rate changes, it directly affects variable mortgage rates, lines of credit, and other loans.

How to Choose the Right Mortgage

Choosing the right mortgage depends on several factors, including your financial situation, risk tolerance, and future plans. Here are some tips to help you decide:

Assess Your Financial Situation:  Consider your current income, expenses, and how stable your financial situation is. If you prefer predictable payments, a fixed-rate mortgage might be the best choice.

Consider Your Plans:  If you plan to stay in your home for a long time, a fixed-rate mortgage offers stability. However, if you might move or refinance in a few years, a variable rate could save you money initially.

Evaluate Market Trends:  Keep an eye on market trends and economic forecasts. If interest rates are expected to rise, locking in a fixed rate now could be advantageous.

Consult a Mortgage Professional:  Speaking with a mortgage broker or financial advisor can provide personalized advice based on your unique circumstances.

Understanding the current mortgage rates in Calgary and the differences between fixed and variable rates can help you make an informed decision. Whether you opt for the stability of a fixed rate or the potential savings of a variable rate, make sure to evaluate your financial situation and future plans. For more detailed information and personalized advice, consider consulting with a mortgage professional.

If you're ready to explore your mortgage options or need further guidance, don't hesitate to contact us. We're here to help you navigate the mortgage landscape and secure the best rates for your needs.


Read

Recently Sold Homes In Calgary

Unlocking the Power of Data: Jerry Charlton’s Interactive Calgary Real Estate Visual in Power BI

In the ever-evolving world of real estate, information is power. Whether you’re a homebuyer, seller, or investor, making informed decisions is crucial to success. Jerry Charlton, a busy Calgary Realtor, has harnessed the power of data to create an extraordinary interactive visual in Power BI that offers unparalleled insights into the Calgary real estate market. This tool, with its comprehensive data and user-friendly interface, is designed to help you navigate the complexities of buying, selling, and investing in Calgary’s diverse neighborhoods.

The Comprehensive Overview: Exploring Over 200 Calgary Communities

The first page of this interactive visual is a treasure trove of information. It allows users to choose from over 200 communities in Calgary, offering a granular view of the real estate landscape. Once a community is selected, you can further refine your search by choosing the type of home: Detached, Attached, Apartments, or Half Duplexes. This specificity ensures that you get the most relevant data tailored to your needs.

Key Metrics at Your Fingertips

On this page, the tool presents crucial metrics, including the number of sales, property style, minimum and maximum sold prices, average sold prices and average sold prices per square foot. Additionally, a map shows the exact locations of these homes within the chosen community, providing a visual representation of the market distribution.

This wealth of data is invaluable for understanding the market dynamics in any given community. Whether you’re curious about the price range of detached homes in a specific area or want to see where most apartments are selling, this page offers a clear and detailed overview.

Recent Sales: Diving into the Details

The Recent Sales page takes the data a step further, offering a list of actual sales. This page is particularly useful for those who want to delve into the specifics of recent transactions.

Detailed Transaction Data

For each sale, the visual provides the sold date, original list price, sold price, percentage of sold price to list price, days on the market (DOM), sold price per square foot, size, address, number of bedrooms and bathrooms, whether there’s an ensuite, if there’s a garage, and the style of the home.

This detailed breakdown allows you to see how individual properties are performing relative to their list prices and how quickly they’re selling. It’s an excellent resource for both buyers and sellers looking to gauge market activity and trends.

Historical Trends: Average Prices Over Time

For investors and analysts, understanding historical price trends is essential. The Avg Prices page provides a comprehensive view of the market over the past decade, showing yearly high, low, and average prices for both sale prices and sale prices per square foot.

Visualizing Market Trends

This page features a graph that tracks these prices over time, offering a clear picture of how the market has evolved. This historical data is particularly useful for identifying long-term trends and patterns, helping investors make informed decisions about where and when to invest.

Size vs. Price: The Scatter Chart

The Size/Price Chart is another powerful tool within this interactive visual. It shows sales from the past 180 days on a scatter chart, with size in square feet along the bottom and sold prices along the side. Each dot on the chart represents an actual sale, providing a visual representation of the relationship between home size and sale price.

Insights at a Glance

This scatter chart is incredibly useful for identifying outliers and trends in the market. For instance, you can quickly see if larger homes are consistently selling for higher prices or if there’s a wide range of prices for homes of similar sizes. This information can be crucial for pricing strategies and understanding market value.

A Tool for Everyone

Combined, these four pages offer a wealth of information to home buyers, sellers, and investors looking to make better-informed decisions in the Calgary real estate market. Jerry Charlton’s interactive visual in Power BI is not just a tool; it’s a comprehensive resource that brings transparency and clarity to the real estate market.

Empowering Home Buyers

For home buyers, this tool provides a detailed understanding of the market dynamics in their desired communities. By exploring the number of sales, property styles, and price ranges, buyers can make informed decisions about where to purchase. The Recent Sales page offers a glimpse into what similar homes have sold for, helping buyers set realistic expectations and make competitive offers.

Supporting Sellers

Sellers benefit immensely from this tool as well. By understanding the average sold prices and market trends, they can price their homes more accurately and strategically. The detailed transaction data provides insights into how quickly homes are selling and at what prices, enabling sellers to position their properties effectively in the market.

Guiding Investors

Investors, perhaps more than anyone, rely on data to make profitable decisions. The historical price trends and scatter charts offer valuable insights into market fluctuations and potential investment opportunities. By identifying communities with stable or rising prices, investors can make informed choices about where to allocate their resources.

Jerry Charlton’s interactive visual in Power BI is a game-changer for the Calgary real estate market. By providing detailed, accurate, and up-to-date information, this tool empowers home buyers, sellers, and investors to make smarter decisions. Whether you’re looking to buy your first home, sell a property, or invest in Calgary’s vibrant real estate market, this interactive visual offers the insights you need to succeed. Explore it today and unlock the power of data in your real estate journey.

Read

Calgary Real Estate Market Update: May 2024

As we welcome the warmth of spring in Calgary, the real estate market is showing signs of renewed activity. In this article, we'll delve into the current state of the market, exploring trends, statistics, and expert insights to help you make informed decisions.

Market Overview

The Calgary real estate market has experienced a steady recovery since the pandemic. According to the Calgary Real Estate Board (CREB), April 2024 saw a 12% increase in sales compared to the same period last year. This growth is largely driven by the detached home sector, which accounts for over 60% of total sales.

Detached Homes

The detached home market is leading the charge, with a 13% year-over-year increase in sales. The benchmark price for detached homes rose 1.3% month-over-month to $749,000, and 13% year-over-year. This growth can be attributed to increased demand, particularly in the $500,000 to $1,000,000 price range.

Semi-Detached and Row Homes

Semi-detached and row home sales have also seen a significant uptick, with a 15% year-over-year increase. The benchmark price for semi-detached homes rose 1.5% month-over-month to $520,000, and 10% year-over-year. Row home prices saw a 1.2% month-over-month increase to $430,000, and a 9% year-over-year increase.

Condominiums

The condominium market is slowly gaining momentum, with a 5% year-over-year increase in sales. The benchmark price for condominiums remained stable, with a 0.5% month-over-month decrease to $270,000, but a 3% year-over-year increase.

Neighborhood Spotlight: Beltline and Downtown

The Beltline and Downtown areas are experiencing a surge in popularity, driven by the demand for inner-city living and proximity to amenities. Sales in these areas have increased by 20% year-over-year, with the benchmark price for detached homes rising 15% to $1,200,000, and condominium prices increasing 5% to $400,000.

Expert Insights

"Calgary's real estate market is showing promising signs of growth, particularly in the detached home sector," says Jerry Charlton, a seasoned real estate agent with years of experience in the Calgary market. "As the economy continues to recover, we expect to see increased demand and prices stabilizing. It's an excellent time for buyers to explore their options and for sellers to capitalize on the growing market."

What's Next?

As we move into the summer months, we anticipate the market to remain active, with continued growth in the detached home sector. Interest rates are expected to remain stable, making it an attractive time for buyers to enter the market. Sellers, on the other hand, should consider pricing their properties competitively to attract potential buyers.

Conclusion

The Calgary real estate market is poised for a strong summer season, driven by the detached home sector and growing demand in popular neighborhoods like Beltline and Downtown. Whether you're a buyer or seller, it's essential to stay informed and adapt to the changing market conditions. Contact Jerry Charlton and his team to navigate the market with confidence and expertise.

Stay Informed

Subscribe to our newsletter for regular market updates, expert insights, and exclusive listings. Follow us on social media for the latest news and trends in the Calgary real estate market.

Get in Touch

Contact Jerry Charlton and his team to discuss your real estate needs and goals. Call (403) 123-4567 or email jerry@jerrycharlton.com to schedule a consultation today!

Read

MLS Stats - April 2024 for a few Calgary Communities

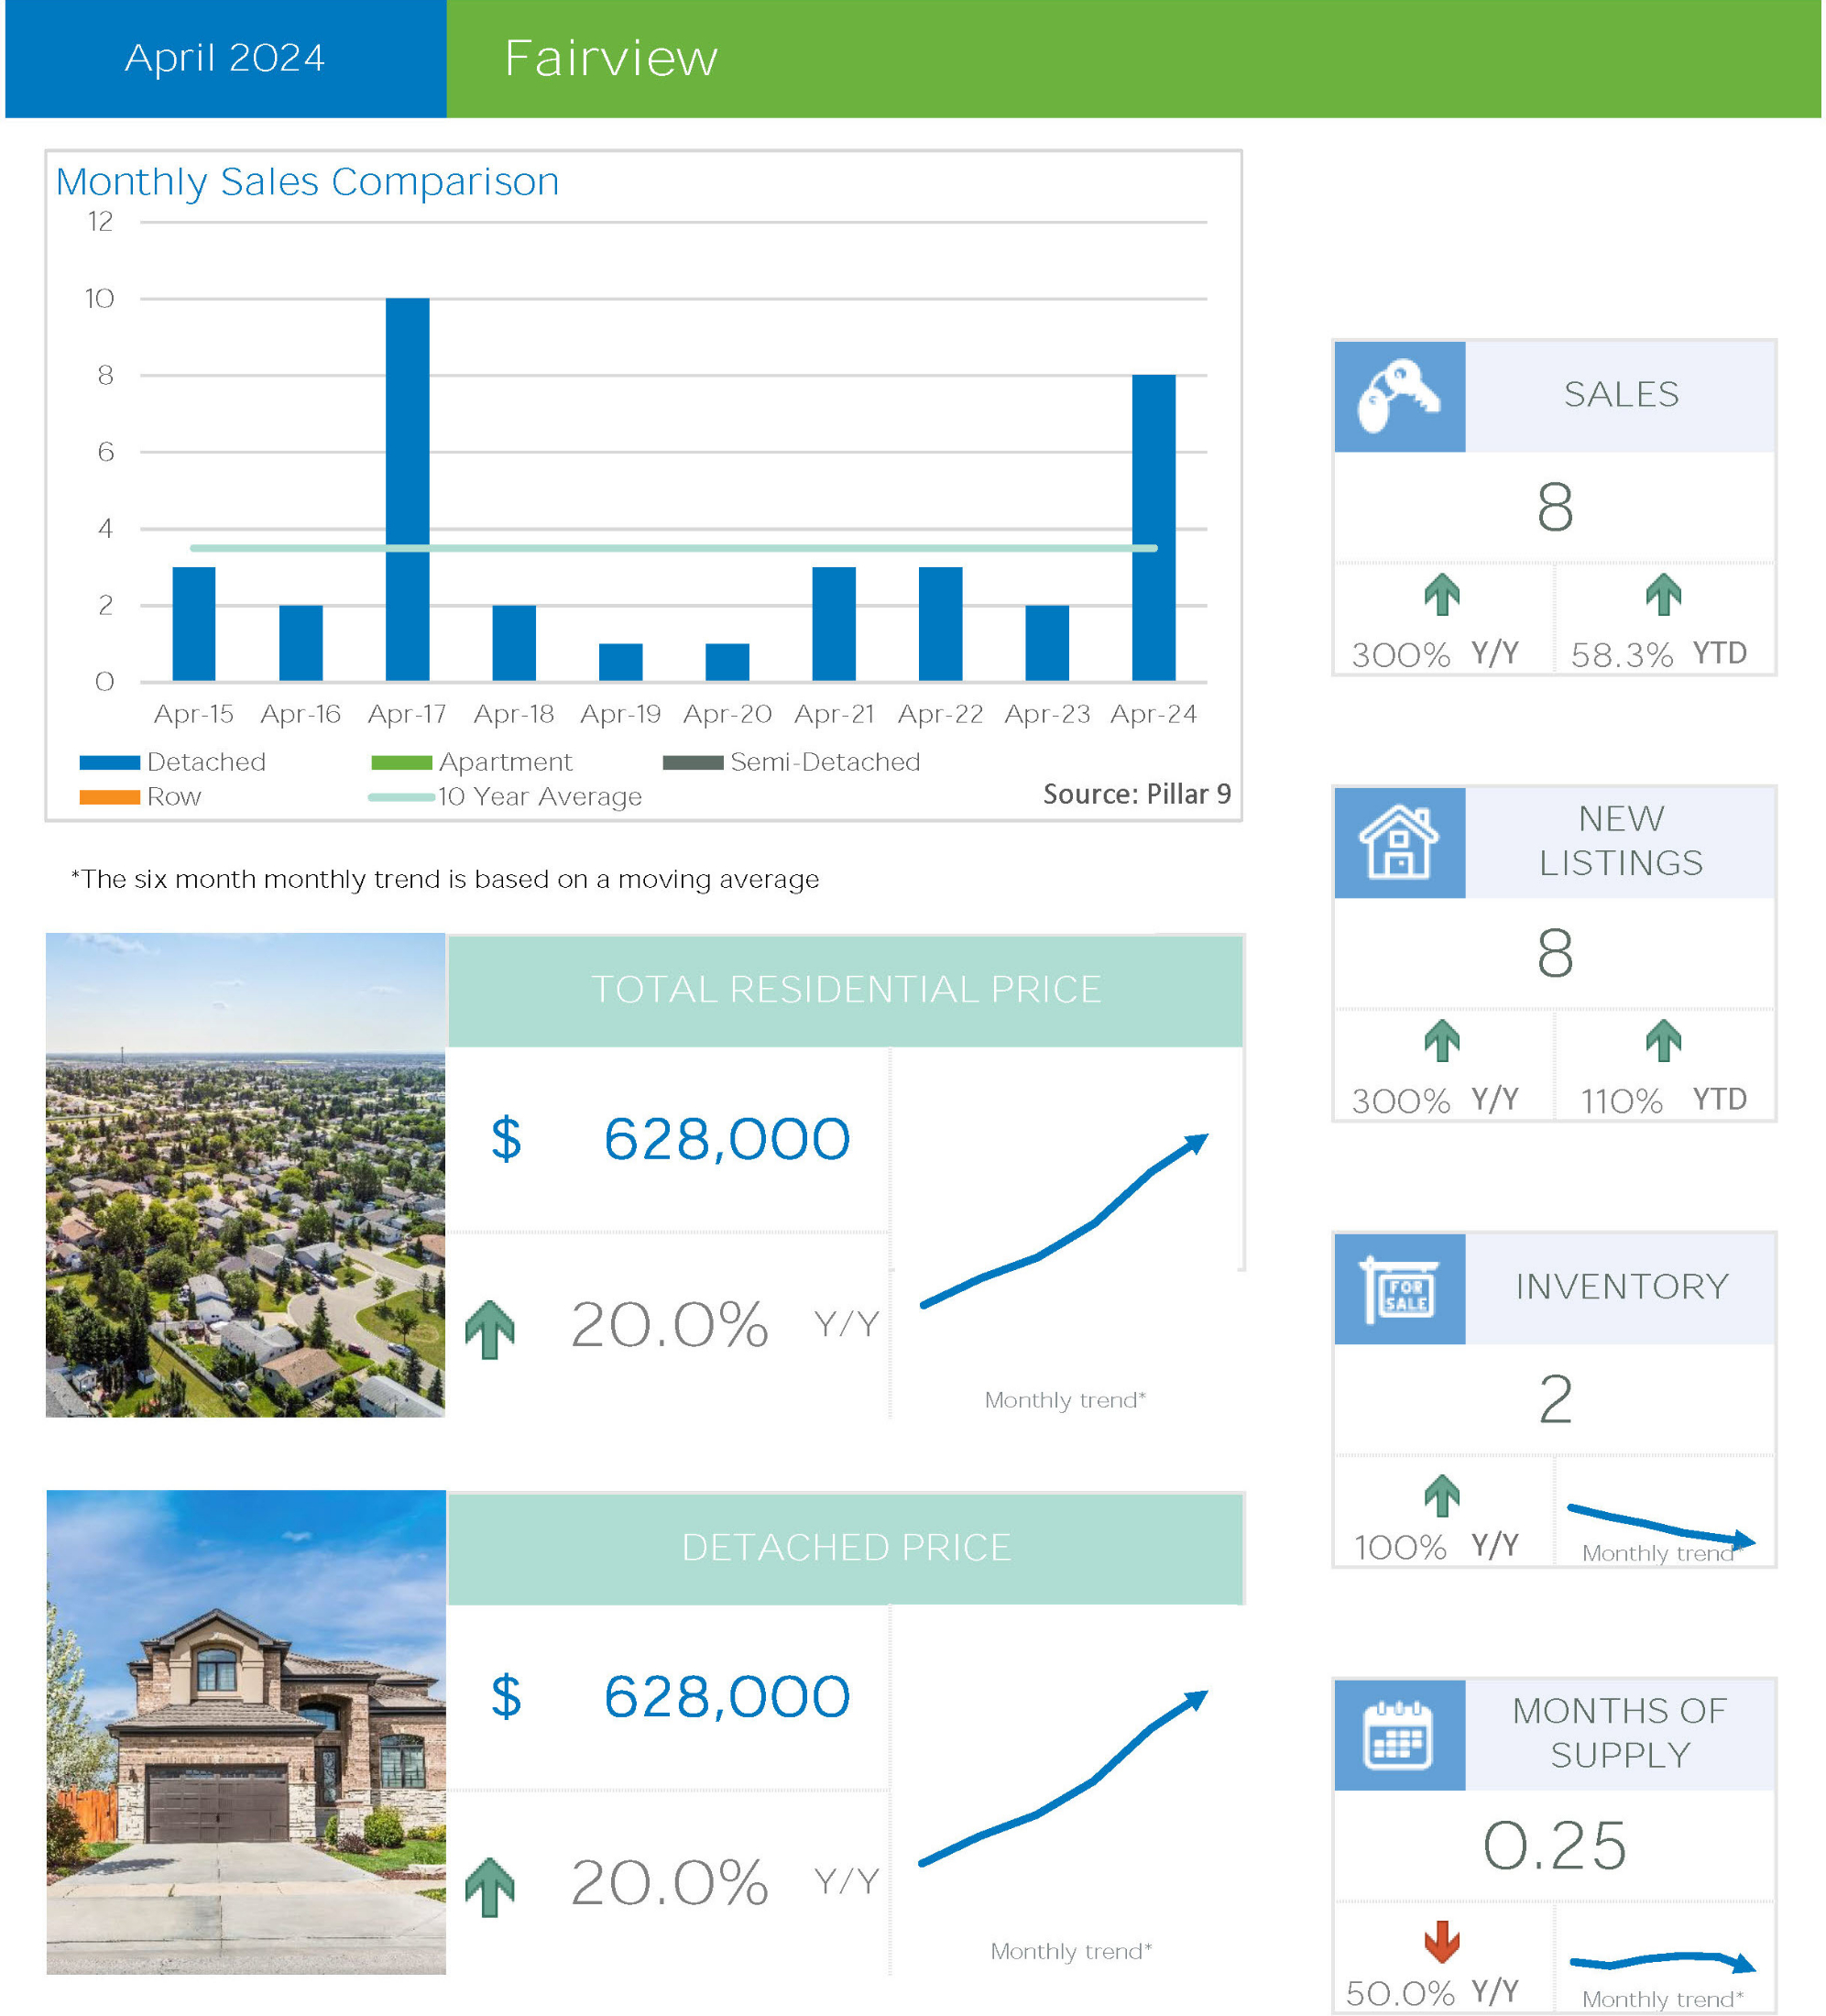
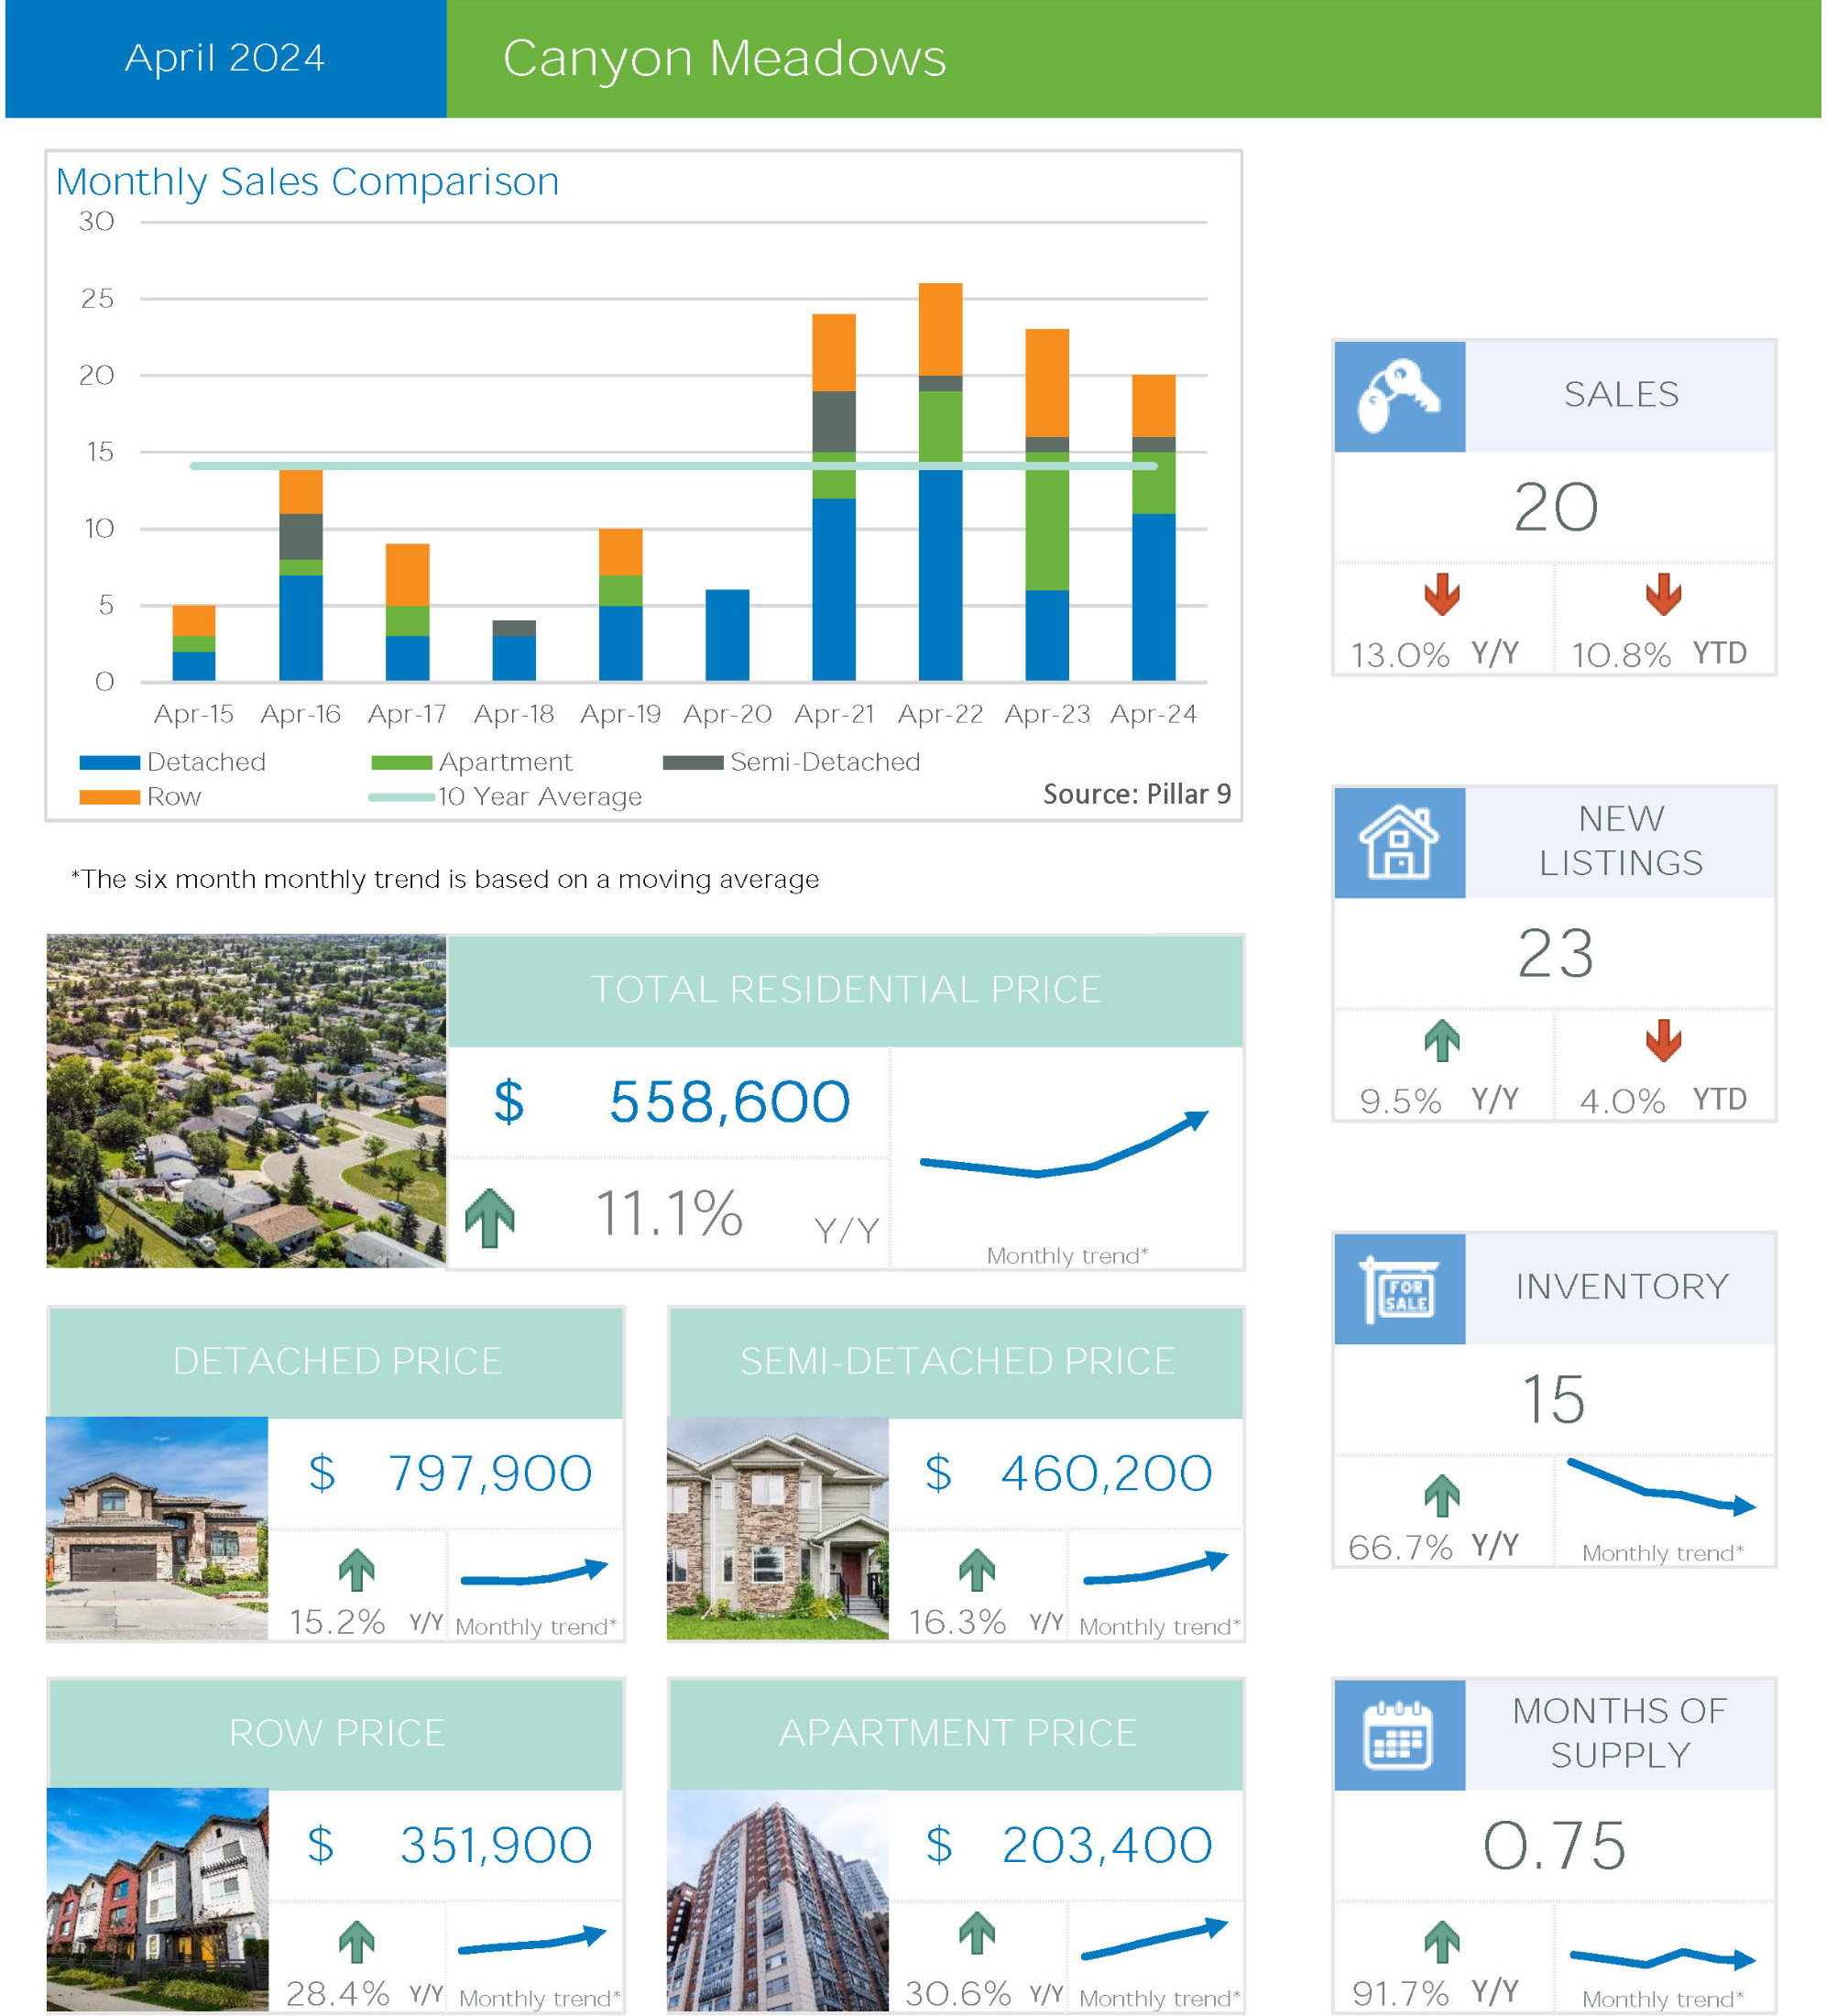
Housing Stats like these for Acadia, Fairview, Haysboro and Canyon Meadows are available through me for every other community in Calgary as well. They are important and helpful to me everyday because that is my job. They might be important to you just a few times in your life. When you are ready to make your next move you want a better understanding of Calgary Real Estate Market conditions at that particular time from a wide angle view to a very narrow focused view and we are here to help you with that.
The questions we start with go something like this: What is the total market doing? What is a community doing? What is a property type doing? What is a property type in a price range doing? What other options are in that price range in Calgary and in closer proximity to the home your are selling or buying.
The answers to those questions and more are part of the process we go through to help buyers and sellers make more confident decisions. Most people only need to make these big real estate decisions a few times in their lives. And we know the more detailed information you have to consider the better!
Let us help you the next time you are ready to make a move. Contact Us Anytime.

Acadia MLS® Stats April 2024

Acadia
MLS® Stats April 2024

14.3% Overall increase year of year is pretty nice for current home owners and real estate investors.

Contacts us for more information on buying and selling Acadia Calgary Real Estate.

Fairview  MLS® Stats April 2024

Fairview
MLS® Stats April 2024

Fairview Real Estate increased by 20% since last year. WoW

Haysboro MLS® Stats April 2024

Haysboro
MLS® Stats April 2024

Kitty corner from Fairview is a much larger area with a wider range of home prices which makes the overall year over year look small. But then look at the 20% increase in detached homes.

Don’t wait to invest in Real Estate - Invest today and Wait..

Canyon Meadows MLS® Stats April 2024

Canyon Meadows
MLS® Stats April 2024

11% Increase would make most people happy. Look closer at the different categories of home types and you’ll see over 30% for Apartments in Canyon Meadows.

Read
Data is supplied by Pillar 9™ MLS® System. Pillar 9™ is the owner of the copyright in its MLS®System. Data is deemed reliable but is not guaranteed accurate by Pillar 9™.
The trademarks MLS®, Multiple Listing Service® and the associated logos are owned by The Canadian Real Estate Association (CREA) and identify the quality of services provided by real estate professionals who are members of CREA. Used under license.