Calgary Real Estate Market Snapshot Report

Which way is the Calgary Real Estate Market Trending Today? This chart shows the Calgary residential real estate market for active and sold listings, organized by price range and property type. For a total market overview, look to the bottom right corner of each chart to compare the current active listings with the sold listings over the past 30 days. A balanced housing market typically requires total listings to equal three times the number of sales in the last 30 days. Listings above that number favour buyers, while listings below that number favour sellers.

Apply the same logic to the segmented housing markets by property type and price range to see whether buyers or sellers are favoured in your area today. This quick snapshot helps you understand whether Calgary is currently experiencing a buyer's market or a seller's market across different segments.

Calgary real estate market activity by price range and property type, including detached, condos, townhomes, and more
Total Calgary Real Estate Market Watch Report


Calgary Detached Homes Market Watch Report

This Chart shows us the Total Calgary Detached Home Market and the Price Range Markets.
Active Listings divided by Sales in the Past 30 Days equals % of listings Sold.
% of Listings Sold is the Odds of Selling in the next 30 Days.

Low % favours buyers. High % Favours Sellers.
Pending Listings are in the "Subject To Buyers Conditions" phase of a potential sale.

Calgary detached home market table showing active listings, sold listings in the past 30 days, pending sales, and sales-to-listings ratio by price range
Calgary Detached Homes – Active, Sold, Pending, and Sales % by Price Range (Updated Daily)

* When Active Listings are equal to 3 times the number of Sold Listings, we have a balanced market. Above that would favour buyers, below that favours sellers.

* Market Savvy Calgary Realtors like Jerry Charlton use this information to help buyers and sellers avoid costly rash decisions when buying or selling Calgary Real Estate. 


Calgary Condo Market Snapshot Report

This Chart shows us the Condo Market and the Price Range Markets.
Active Listings divided by Sales in the Past 30 Days equals % of listings Sold.
% of Listings Sold is the Odds of Selling in the next 30 Days.

Low % favours buyers. High % Favours Sellers.
Pending Listings are in the "Subject To Buyers Conditions" phase of a potential sale.

Calgary condo market table showing active listings, sold listings in the past 30 days, pending sales, and sales-to-listings ratio by price range
Calgary Condo Market – Active, Sold, Pending, and Sales % by Price Range (Updated Daily)

* When Active Listings are equal to 3 times the number of Sold Listings, we have a balanced market. Above that would favour buyers, below that favours sellers.

* Market Savvy Realtors use this information to help buyers and sellers avoid costly rash decisions when buying or selling Calgary Real Estate.


Calgary Townhome Market Snapshot Report

This Chart shows us the Townhome Market and the Price Range Markets.
Active Listings divided by Sales in the Past 30 Days equals % of listings Sold.
% of Listings Sold is the Odds of Selling in the next 30 Days.


Low % favours buyers. High % Favours Sellers.
Pending Listings are in the "Subject To Buyers Conditions" phase of a potential sale.

Calgary townhome market table showing active listings, sold listings in the past 30 days, pending sales, and sales-to-listings ratio by price range
Calgary Townhome Market – Active, Sold, Pending, and Sales % by Price Range (Updated Daily)

* When Active Listings are equal to 3 times the number of Sold Listings, we have a balanced market. Above that would favour buyers, below that favours sellers.

* Market Savvy Realtors use this information to help buyers and sellers avoid costly rash decisions when buying or selling Calgary Real Estate.


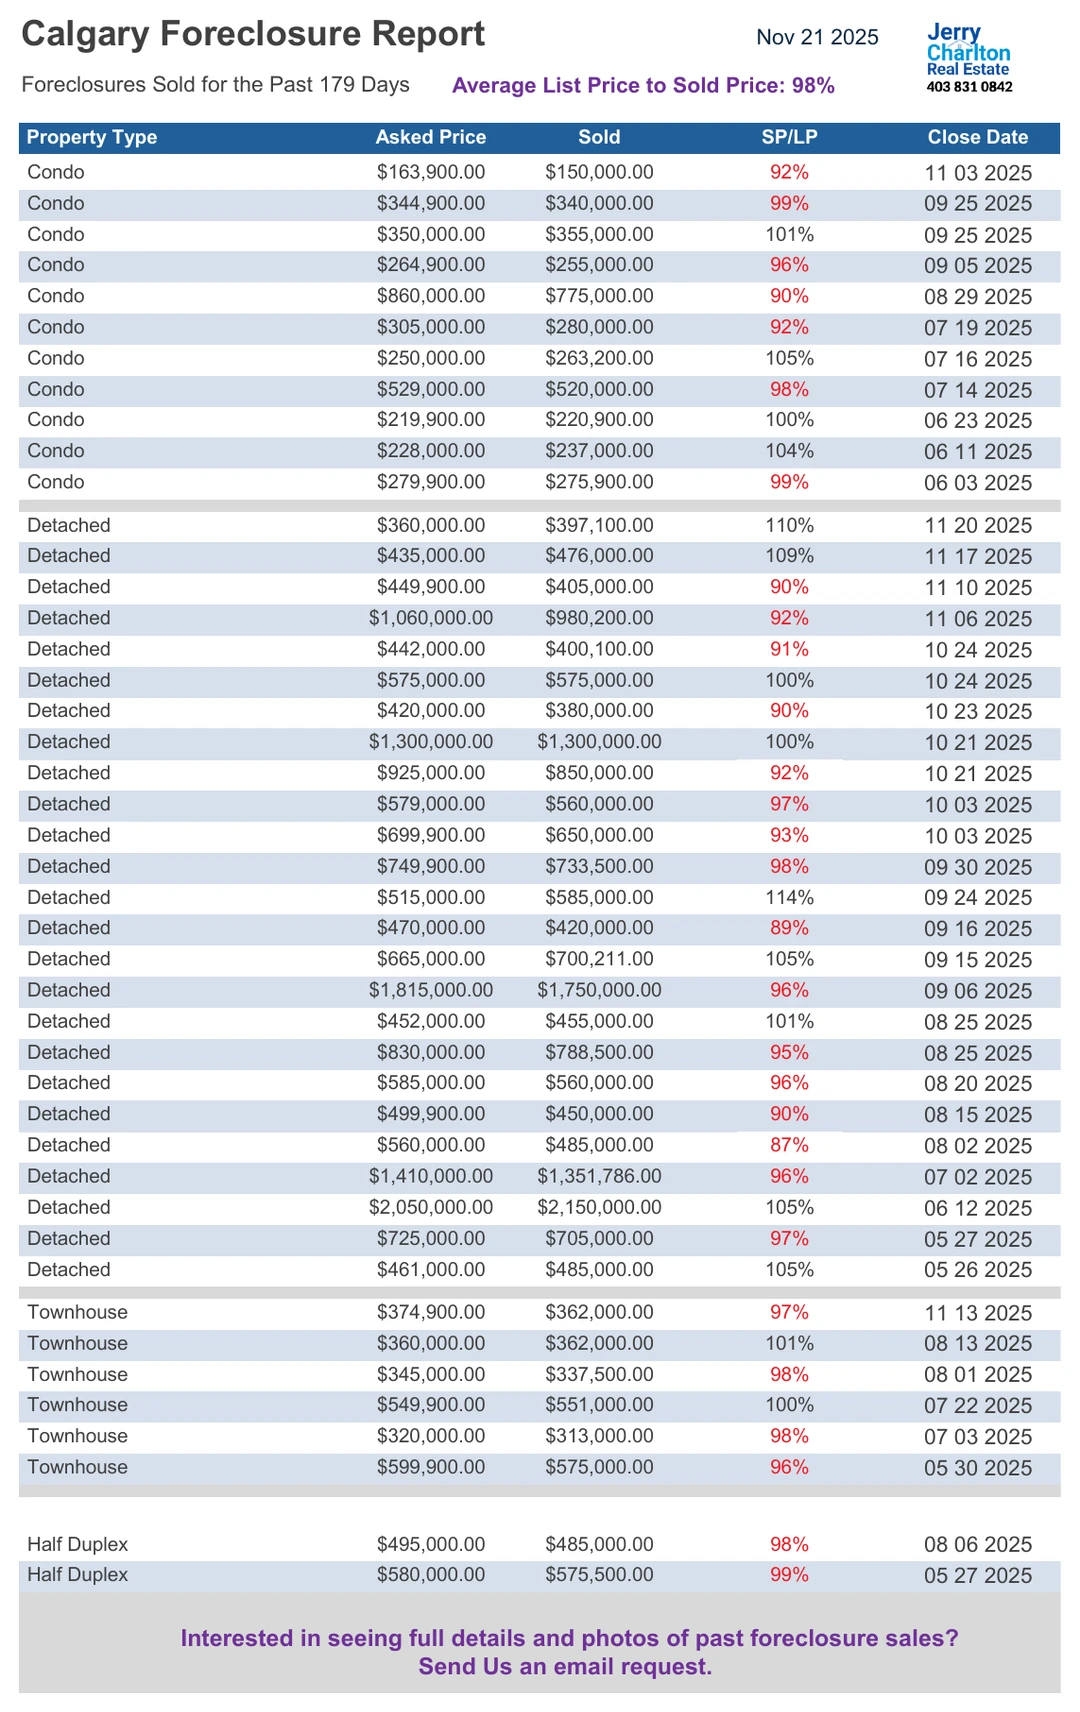
Calgary Foreclosures Market Snapshot Report - Updated Daily

Foreclosures Sold in Calgary come in all types of properties and price ranges. Most sellers are the Courts of Alberta or the Mortgage Lenders and Banks. The Calgary Foreclosure Market is part of the Total Calgary Housing Market and moves with the overall supply and demand in the Calgary Housing Market Charts above.

Because the Market for foreclosed properties is under constant change, today's market of bank owned and court ordered sales will look quite different in the months and years to come. Savvy Calgary Realtors like Jerry Charlton use all the data to keep clients up to date for the brief moments they move in and out of the market.


Calgary foreclosure sales table showing property type, asking price, sold price, sale-to-list ratio, and date sold
Calgary Foreclosures – Most Recent Sold Properties with List Price, Sold Price, % of List, and Sale Date (Updated Daily)
Data is supplied by Pillar 9™ MLS® System. Pillar 9™ is the owner of the copyright in its MLS®System. Data is deemed reliable but is not guaranteed accurate by Pillar 9™.
The trademarks MLS®, Multiple Listing Service® and the associated logos are owned by The Canadian Real Estate Association (CREA) and identify the quality of services provided by real estate professionals who are members of CREA. Used under license.