RSS

Your Real Estate Market is Not the Calgary Real Estate Market

The Calgary Real Estate Market includes everything, everywhere in the city.
That’s not your real estate market. Erase that misconception now.
Your Real Estate Market is unique to you and your needs.

Defining Your Real Estate Market
Three key factors define your real estate market:

  1. Price Range – Every MLS listing falls into a price category. What’s yours?

  2. Property Type – Are you searching for a condo, townhome, or detached home?

  3. Location – Do you want all of Calgary, a specific quadrant, or just a few communities?

Supply and Demand in Your Real Estate Market Niche
Once you’ve defined your market, it’s time to analyze supply and demand:

  1. Active Listings – How many homes are for sale in your niche? (Supply)

  2. Homes Sold in the Last 30 Days – How many are actually selling? (Demand)

  3. Sales-to-Listings Ratio – What percentage of active listings are selling? (Market Balance)

What Type of Market Are You In?
Your real estate market falls into one of three categories:

  1. Buyers’ Market – Less than 50% of listings are selling. More choices, less urgency.

  2. Sellers’ Market – More than 50% of listings are selling. Fewer choices, higher competition.

  3. Balanced Market – Around 50% of listings are selling. A stable environment.

Understanding your real estate market gives you a competitive advantage—whether you’re buying or selling.
You’ll know if you’re up against heavy competition or have the upper hand. That knowledge shapes your strategy and decisions.

Your real estate market is not the Calgary real estate market.
Your market starts with your price range and property type—not city-wide statistics.
Define your market, analyze supply and demand, and focus on what truly matters to you.
The numbers don’t lie. Make them work for you. We can help.

Read

Unlocking Your Calgary Condo's True Value: The Numbers Every Owner Needs to Know

What’s Your Condo Really Worth?

If you’re a Calgary Condo Owner, you’ve probably asked yourself this question more than once. Maybe you’ve checked out a few listings in your building, scrolled through recent sales, or even guessed based on what a neighbor sold for. But the truth is, valuing a condo goes far beyond just the listing price of similar units.

The good news? There’s a proven formula that takes the guesswork out of it—and it applies to any condo, in any building, regardless of its age, location, or condition. Let’s break it down.


The Core Components of Condo Valuation

Most condos are valued using a combination of these key factors:

  1. Size (Price Per Square Foot) – Larger units typically sell for more, but price per square foot can vary significantly based on the building, floor level, and amenities.

  2. Unit Factor (Price Per Unit Factor) – Every condo has a designated unit factor, which determines its share of ownership in the building and is often tied to condo fees. Comparing prices based on unit factor offers another way to determine fair market value.

  3. Recent Comparable Sales – Looking at recently sold units with similar layouts, sizes, and features gives a realistic picture of what buyers are willing to pay.

  4. Adjustments for Condition, Location, and Features – A well-maintained unit with upgrades and a prime view will naturally command a premium. The same floor plan in a less desirable location within the building (near a noisy elevator or with a limited view) may sell for less.

  5. Financial Strength of the Building – A well-funded condo corporation with a solid reserve fund reassures buyers and sustains property values. Buildings with financial concerns, high condo fees, or upcoming special assessments can see values drop.


Applying This Formula to 901 - 10 Ave SW (MARK on 10th)

Let’s take a real-world example. Below are recent sales and active listings in MARK on 10th, a condo building in Calgary. The numbers tell a clear story about how value is determined:

  • Average Price Per Square Foot (1-bedroom units): $678

  • Average Price Per Unit Factor: $11,971

  • Recent 1-Bedroom Sale: $355,000 for 526 sq. ft. ($675 per sq. ft.)

  • Recent 2-Bedroom Sale: $475,000 for 785 sq. ft. ($605 per sq. ft.)

Using these averages, you can get a baseline for your own condo’s value before factoring in unique adjustments like renovations, view, parking, and the overall condition of your unit and building.


Why This Matters for You

If you’re thinking about selling (or just curious about your home’s worth), knowing how your condo is valued gives you a serious advantage. It allows you to:

Price Strategically – Avoid pricing too high and sitting on the market or too low and leaving money on the table. ✔ Negotiate with Confidence – Understand what your unit is truly worth and justify your asking price. ✔ Plan for the Future – Whether you’re refinancing, investing, or selling, knowing your condo’s value helps you make informed decisions.


Get a Custom Calgary Condo Valuation Report – For Free

Your condo isn’t just a number on a spreadsheet—it’s unique. And while formulas and averages are a great starting point, getting an accurate valuation means factoring in the specifics of your unit and building.

I specialize in providing condo owners with detailed, data-driven valuation reports based on real market trends and current sales. If you want to know exactly what your condo is worth today (not just an estimate from a generic online tool), request your free custom condo report now.

📞 Call/Text: 403-831-0842 📧 Email: Jerry@JerryCharlton.com 🌐 Request your free report

Don’t leave money on the table, let’s find out what your place is really worth!

Read

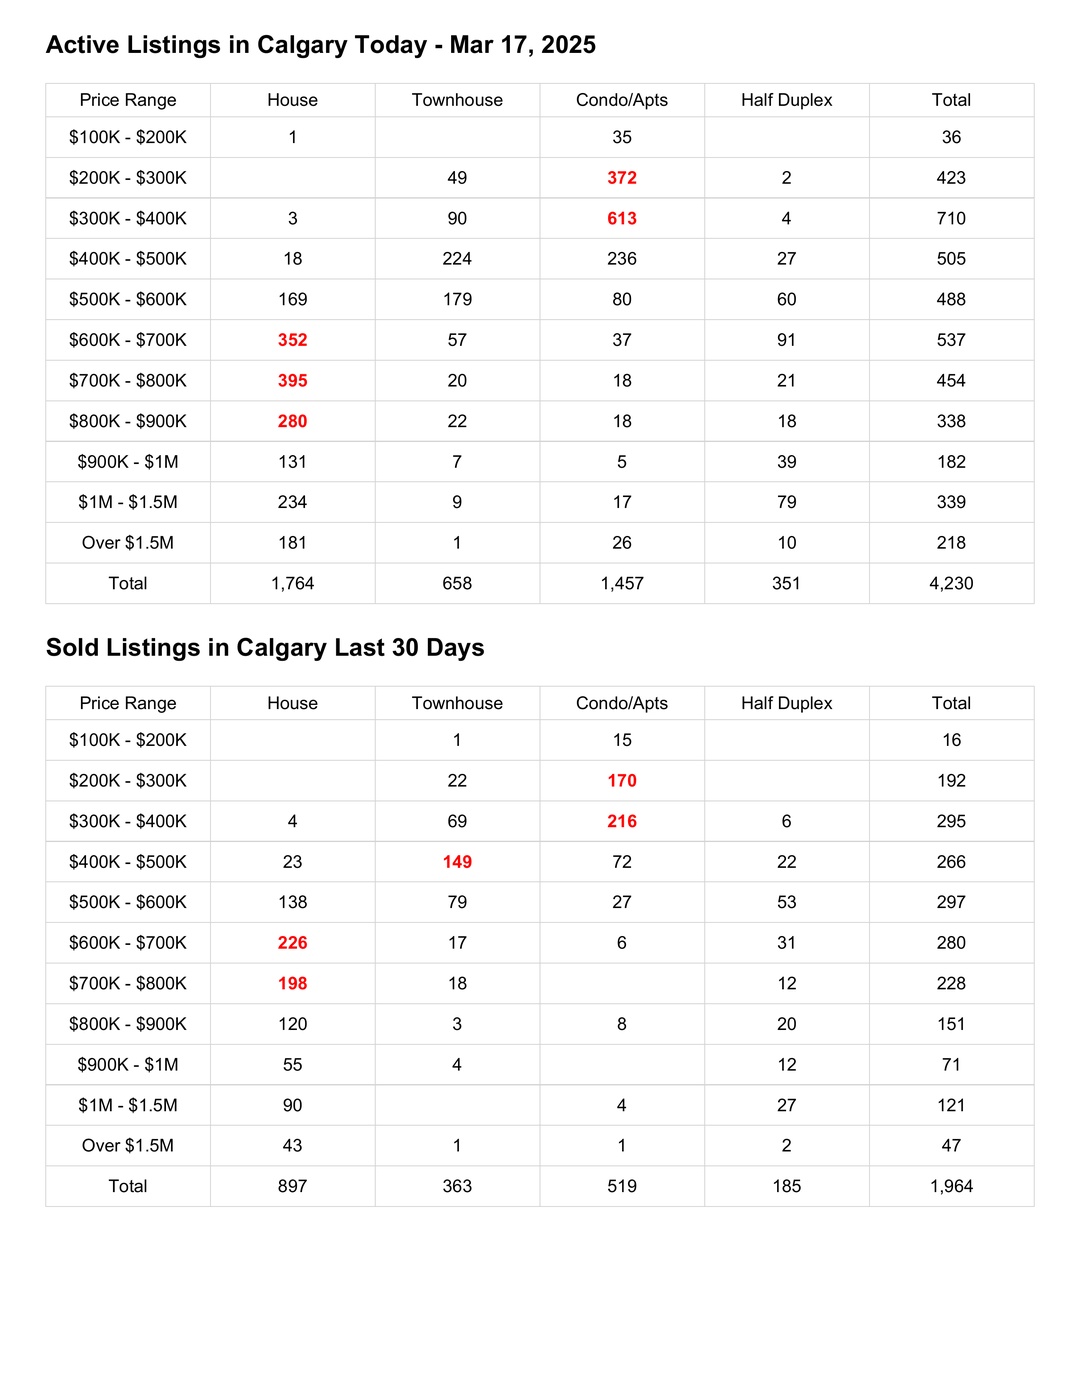
Your Real Estate GPS

This chart is your real estate GPS—it tells you if your market is hot, cold, or balanced based on your home type and price range. Whether buying or selling, use this data to set realistic expectations and make smart decisions.


Buyer Example: House in the $700K - $800K Range

A buyer is pre-approved for $750,000 and is looking for a detached home in Calgary. The chart shows:

  • 343 active house listings in this price range.

  • 188 houses sold in the last 30 days.

This means supply is greater than demand, but homes are still selling at a steady pace. This is a balanced market—buyers have choices, but good homes will still attract multiple offers.

Buying Strategy:

  • Since there are 343 active homes, the buyer has options and can negotiate.

  • They should look for listings that have been on the market longer, as sellers may be more flexible.

  • However, since 188 homes sold last month, desirable properties can still move fast—so having pre-approval ready is an advantage.


Seller Example: Condo in the $200K - $300K Range

A condo owner is planning to sell their unit in the $200K - $300K range. The chart shows:

  • 316 active condo listings.

  • 168 condos sold in the last 30 days.

This suggests a buyer’s market, where supply exceeds demand. Sellers in this range need to be strategic to attract offers.

Selling Strategy:

  • With many competing condos, pricing must be competitive—listing too high may lead to a longer time on the market.

  • High-quality photos, staging, and marketing will help the condo stand out.

  • Offering buyer incentives, such as covering closing costs or including appliances, could attract more interest.


Final Thought:

Instead of asking, “How’s the market?”, the real question is, “How’s the market for the home type and price range I’m interested in as a seller or a buyer?”.
With the right question, both buyers and sellers can use this data to their advantage.

Read
Data is supplied by Pillar 9™ MLS® System. Pillar 9™ is the owner of the copyright in its MLS®System. Data is deemed reliable but is not guaranteed accurate by Pillar 9™.
The trademarks MLS®, Multiple Listing Service® and the associated logos are owned by The Canadian Real Estate Association (CREA) and identify the quality of services provided by real estate professionals who are members of CREA. Used under license.